Human validation
Stimuli
While stratifying genres and the presence of vocals, 100 tracks were selected from either of the two proposed datasets:
- Jamendo-A: 2,559 tracks from the MTG-Jamendo dataset after k-means clustering sampling.
- Jamendo-B: 1,119 tracks from the MTG-Jamendo dataset, which were unanimously rated as “Emotionally Conveying” by three annotators (the authors and colleagues).
To compare the subjective ratings, we included 100 tracks from each of the following control stimuli groups:
- Spotify previews: 2,100 Spotify 30-second audio previews from the MusAV dataset, which is a collection of music tracks available under Spotify’s terms of service.
- Suno-v4.5: 1,280 tracks generated by the Suno model v4.5 with rudimentary prompts (e.g.,
"angry Finnish Classical music").
Procedure
An online experiment was conducted as follows.
Participants first selected three of their favorite tracks using the Apple MusicKit API. They then rated 30-second previews of the three self-selected tracks and 20 experimenter-selected tracks on six scales after reading the following instructions:
- Professionalism: “How professional does this music sound? Consider in terms of audio quality, composition, performance, and production, and any criteria you may have.”
- Familiarity: “How familiar does this music sound? This is not whether you recognize this particular song, but whether it sounds similar to music you have heard before in terms of instrumentation, style, or other factors.”
- Perceived Valence: “How positive or negative feelings do you think this music expresses? Consider how much the music sounds happy, joyful, amusing, or positive, or how much it sounds sorrowful, agitating, or negative.”
- Perceived Arousal: “How exciting or relaxing does this music sound? Consider how much the music sounds energizing, exciting, or stimulating, or how much it sounds calming, relaxing, or soothing.”
- Liking: “How much do you like this music? Consider how much you enjoy listening to it, how much you would like to listen to it again, and any other factors that contribute to your enjoyment.”
- Being Moved: “How strongly are you moved or touched by this music? Think about whether it gives you chills or goosebumps, or if it just bores you or even disgusts you.”
On average, experimenter-selected tracks were rated by 10.4 participants.
After the ratings, participants completed a series of questionnaires, including the Goldsmiths Musical Sophistication Index (Gold-MSI) and questions on preferred musical genres.
All procedures were approved by the ethics committee of the Max Planck Society.
Participants
Via an online experiment platform, Prolific, 233 participants completed the tasks.
Participants were compensated at a rate of 9 GBP per hour. After excluding those who displayed invalid behaviors, a total of 4,600 ratings from 190 unique participants were analyzed.
The modal age was 21 years, with a range from 18 to 40. The sample consisted of 69% males, 73% white individuals, 88% born in the US or UK, and 93% residing in the US or UK.
At least two years of musical experience was required for participation.
The modal percentiles of the Gold-MSI subscales were 79% for Musical Training and 75% for Musical Emotions.
Results
Distribution of ratings
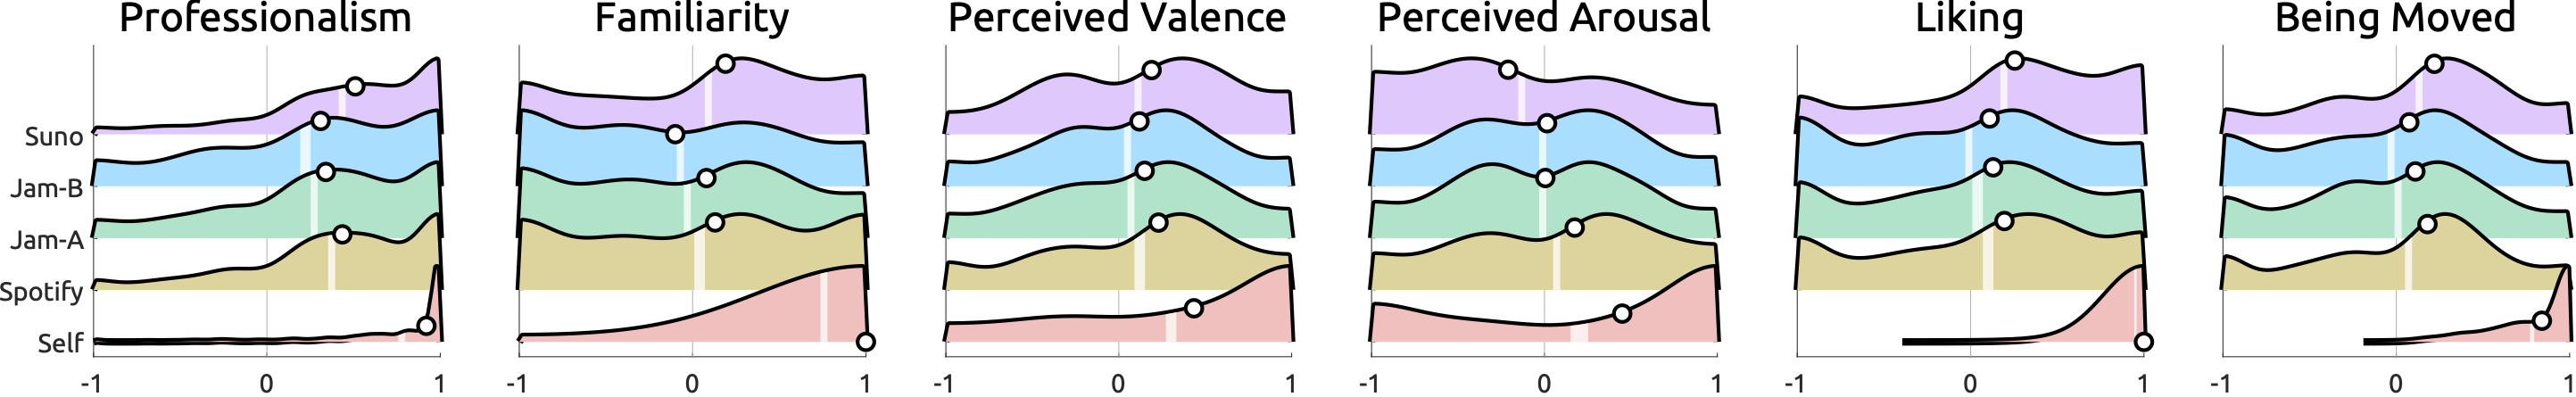
Ridgelineplots. White circles mark medians. White vertical bars mark 95%-confidence intervals of the mean.
Linear mixed-effects models
A model was fitted to each scale using fitlme in MATLAB:
mdl_p = fitlme(TblLme, 'professionalism ~ age + sex + gmsiEmotion + gmsiTraining + (1 + isThisMyGenre | subjectId) + (1 | trackId)')
mdl_f = fitlme(TblLme, 'familiarity     ~ age + sex + gmsiEmotion + gmsiTraining + (1 + isThisMyGenre | subjectId) + (1 | trackId)')
mdl_v = fitlme(TblLme, 'valence         ~ age + sex + gmsiEmotion + gmsiTraining + (1 + isThisMyGenre | subjectId) + (1 | trackId)')
mdl_a = fitlme(TblLme, 'arousal         ~ age + sex + gmsiEmotion + gmsiTraining + (1 + isThisMyGenre | subjectId) + (1 | trackId)')
mdl_l = fitlme(TblLme, 'liking          ~ age + sex + gmsiEmotion + gmsiTraining + (1 + isThisMyGenre | subjectId) + (1 | trackId)')
mdl_m = fitlme(TblLme, 'moved           ~ age + sex + gmsiEmotion + gmsiTraining + (1 + isThisMyGenre | subjectId) + (1 | trackId)')
Each participant’s musical preference was coded in isThisMyGenre, which is 1 if the track was rated as their favorite genre and 0 otherwise. Then this was used to fit a random slope for each subject. Download this MATLAB data and script to replicate the analysis.
Association between scales
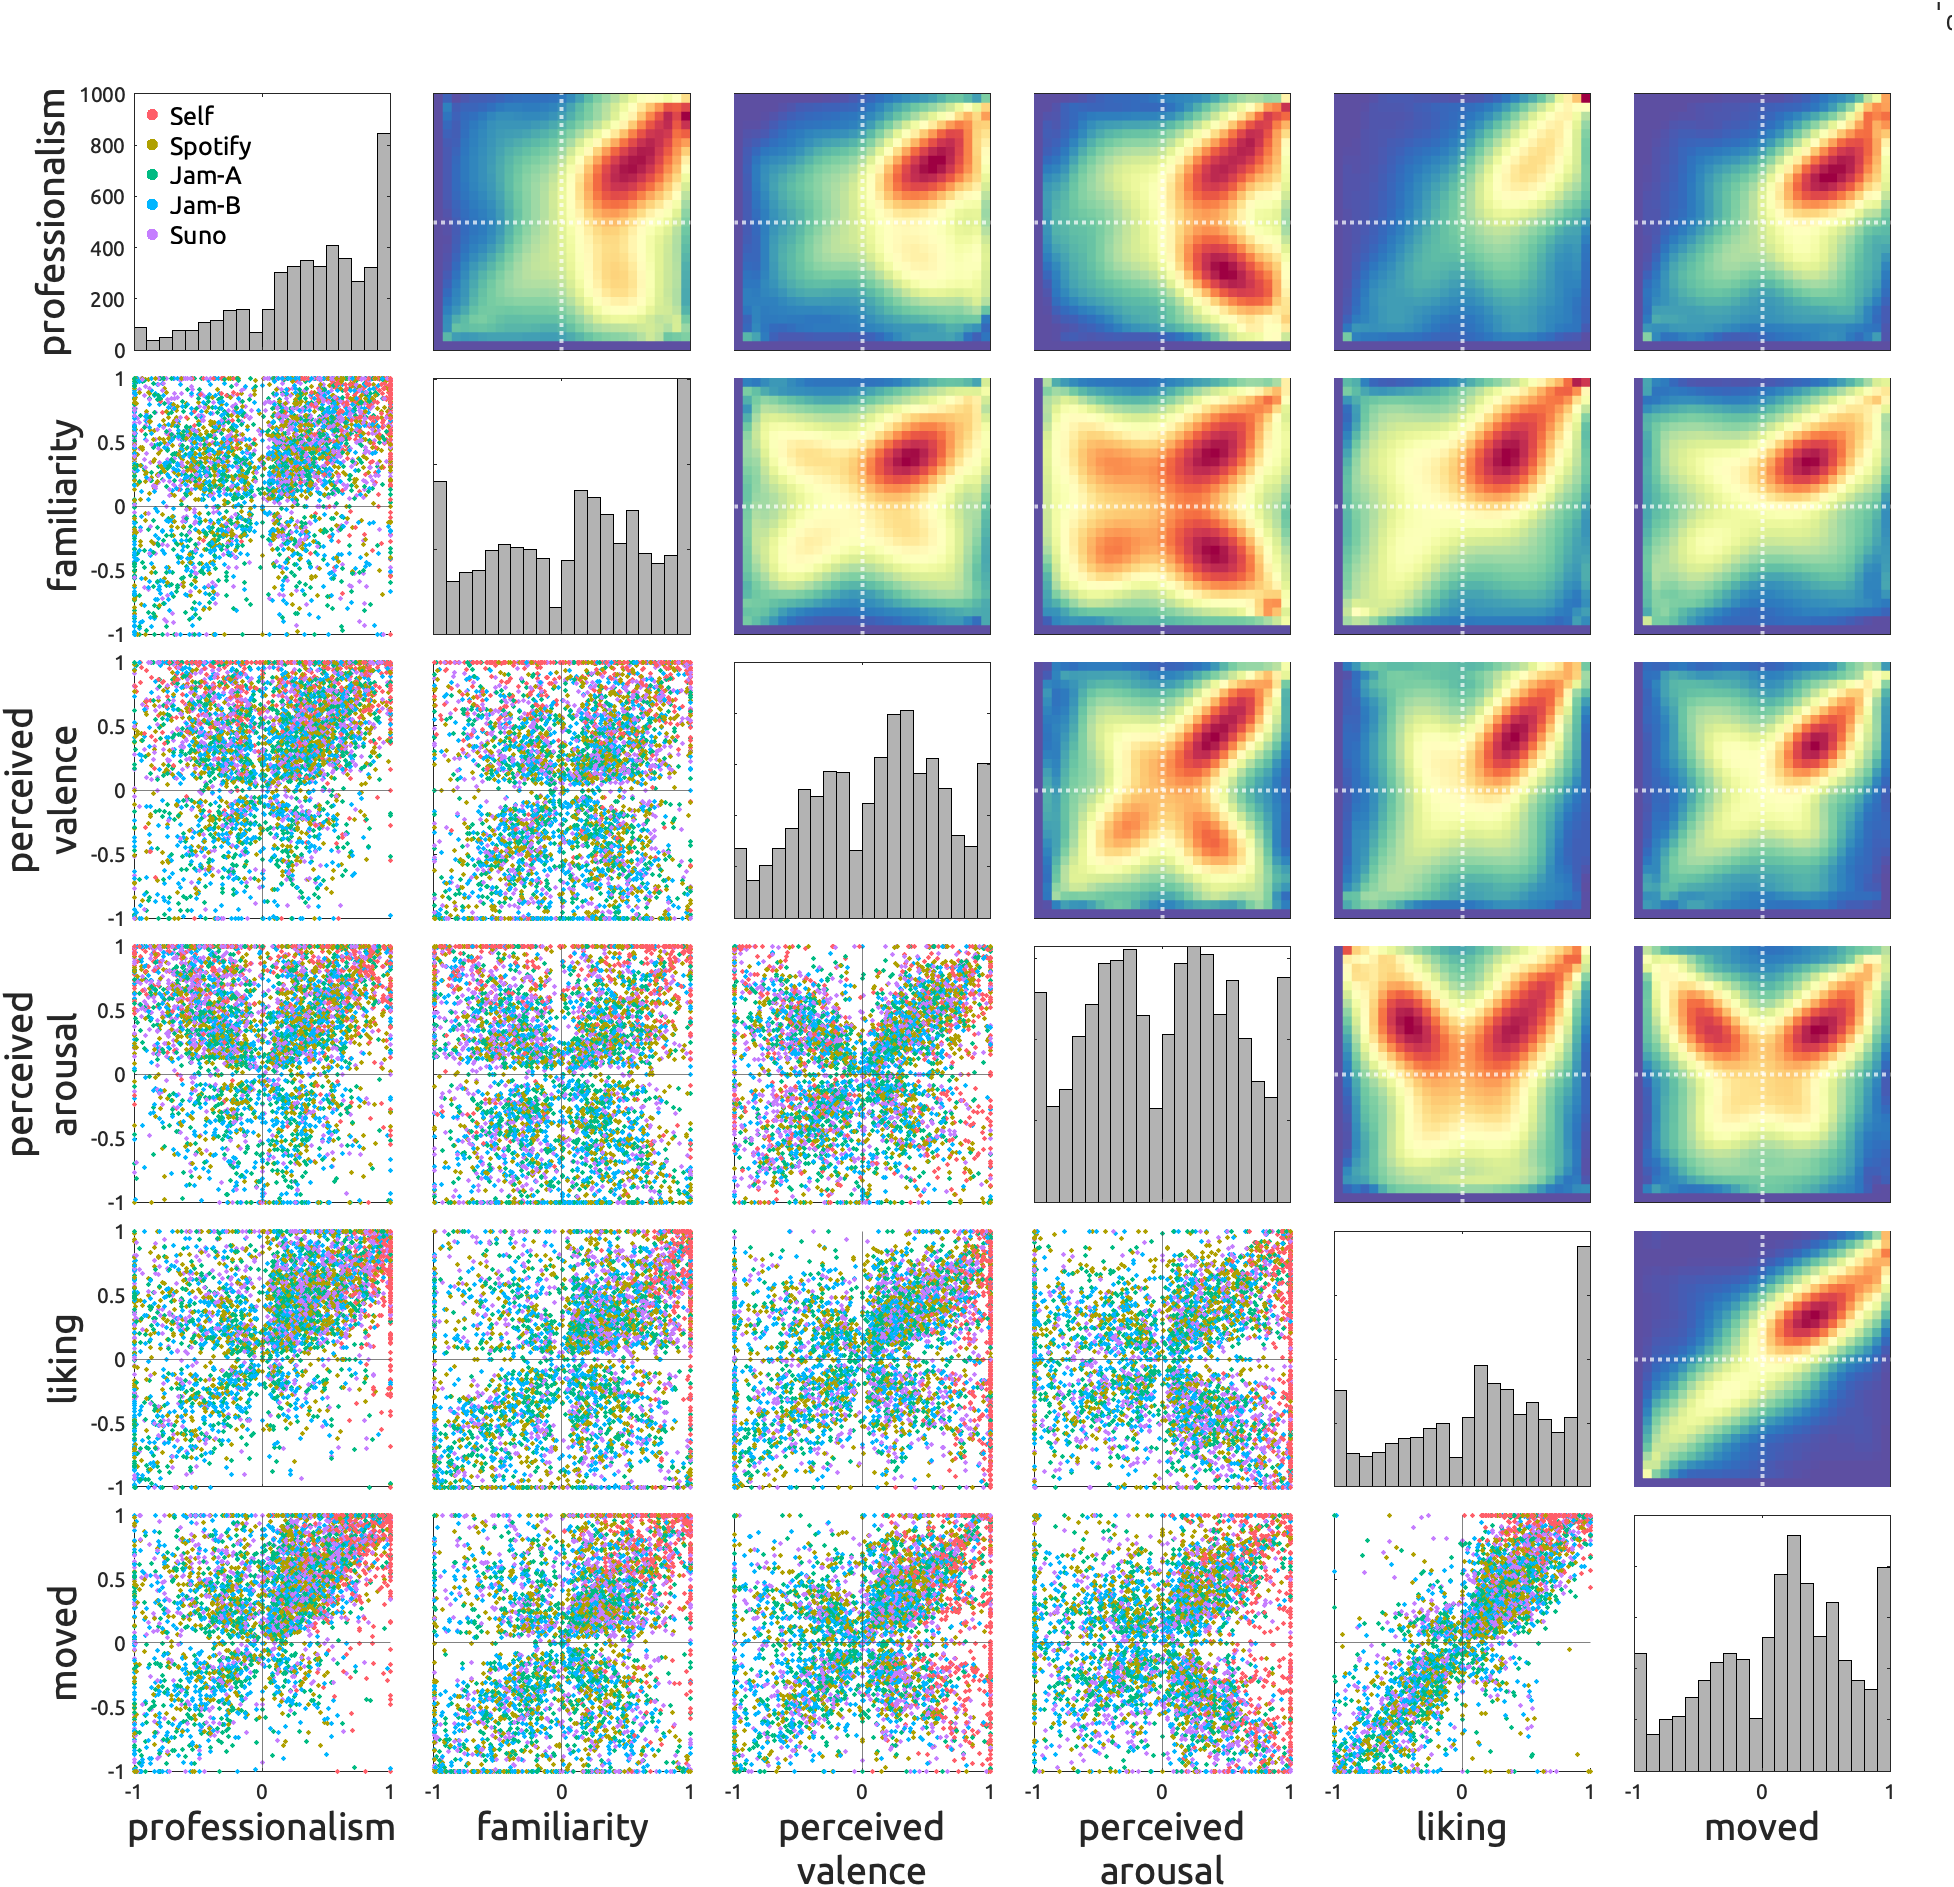
Scatter and kernel density plots. Diagonal panels show histograms of each scale. Lower triangle panels show individual ratings—each dot represents an individual rating of multivariate scales, given to a track by a participant. Color-coding marks the type of music source. Upper triangle panels show kernel densities.
Cross-subject reliability of ratings
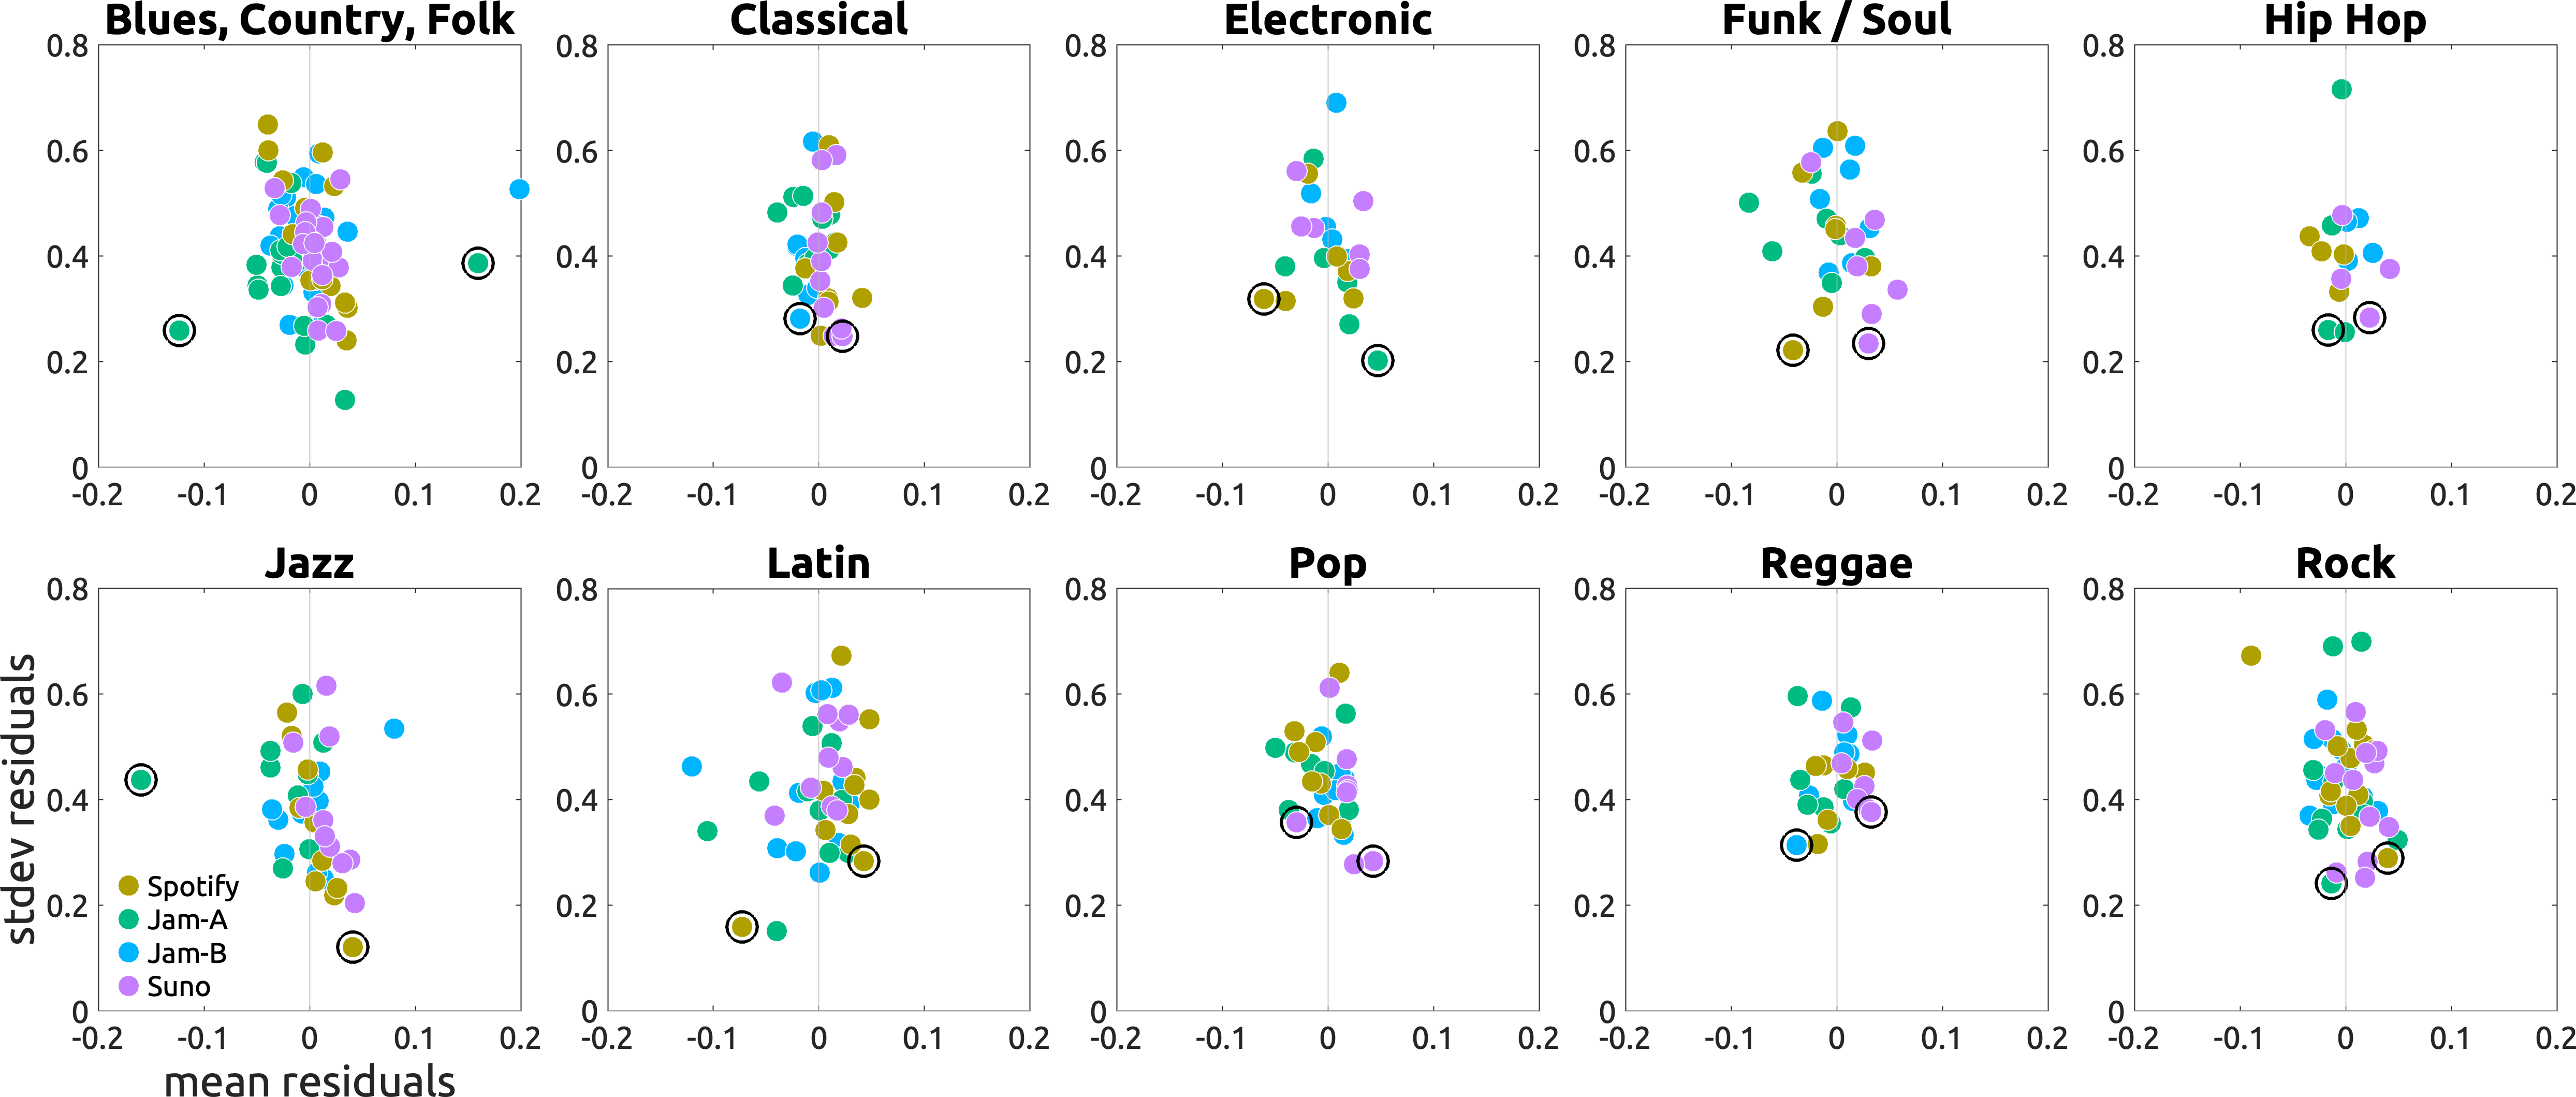
Mean-variance plots. Each dot represents a track with the averaged residual of liking over X-axis and the standard deviation over Y-axis. Tracks in the lower-right corners were consistently liked. Tracks in the lower-left corners were consistently disliked. Black circles mark tracks that are closest to either corner (i.e., (+1, 0) or (-1, 0)).